

 Reviewed by
 I went looking for a reliable number on what a wedding registry is actually worth to the store fulfilling it. What I found was the same figure sitting in a dozen blog posts. None of them cited anybody. Follow any one back and the trail ends at another blog quoting a third blog.
That is a real problem if you are building a business case for a registry on your WooCommerce store. You cannot plan around a number nobody stands behind.
So this page does the opposite. Every one of the gift registry statistics below carries a live link plus a date, straight to the organization that published the figure. Nothing here comes from an estimate or another roundup.
Some widely quoted numbers turned out to have no primary source. I have named those in the methodology section instead of repeating them. That is the same standard behind our cart abandonment statistics.
Jump to:
- How Big The Gift Registry Market Actually Is
- Registry Adoption And Shopper Behavior
- What Guests Reach For When There Is No List
- What A Registry Is Worth To The Store
- What Returns Data Says About The Wrong Gift
- When Registry Purchases Actually Happen
- What These Numbers Mean For A WooCommerce Store
- How To Measure Registry Performance In Your Store
- Methodology And Sources
- Frequently Asked Questions: Gift Registry Statistics
- Put Gift Registry Statistics To Work In Your Store
How Big The Gift Registry Market Actually Is
Nobody publishes a credible figure for the size of the gift registry market. That is the honest starting point, worth saying out loud before anyone quotes a dollar value at you.
What does exist is solid government data on two things. First, how often the life events behind registries happen. Second, how much retail now runs through online stores.
- Marriages in the United States: According to the CDC’s National Center for Health Statistics, there were 2,041,926 marriages. That is provisional 2023 data, the most recent on the FastStats page as of August 2026.
- Births in the United States: NCHS reported 3,606,400 births in 2025, down 1% from 2024. The report draws on 99.95% of registered births, and the CDC published it in April 2026.
- Median age at first marriage: 30.8 for men and 28.4 for women in 2025, per the US Census Bureau. In 1975 it was 23.5 and 21.1.
- Married-couple households: Married couples made up fewer than half of US households (47%) in 2025, per the same release. That is down from 66% fifty years earlier.
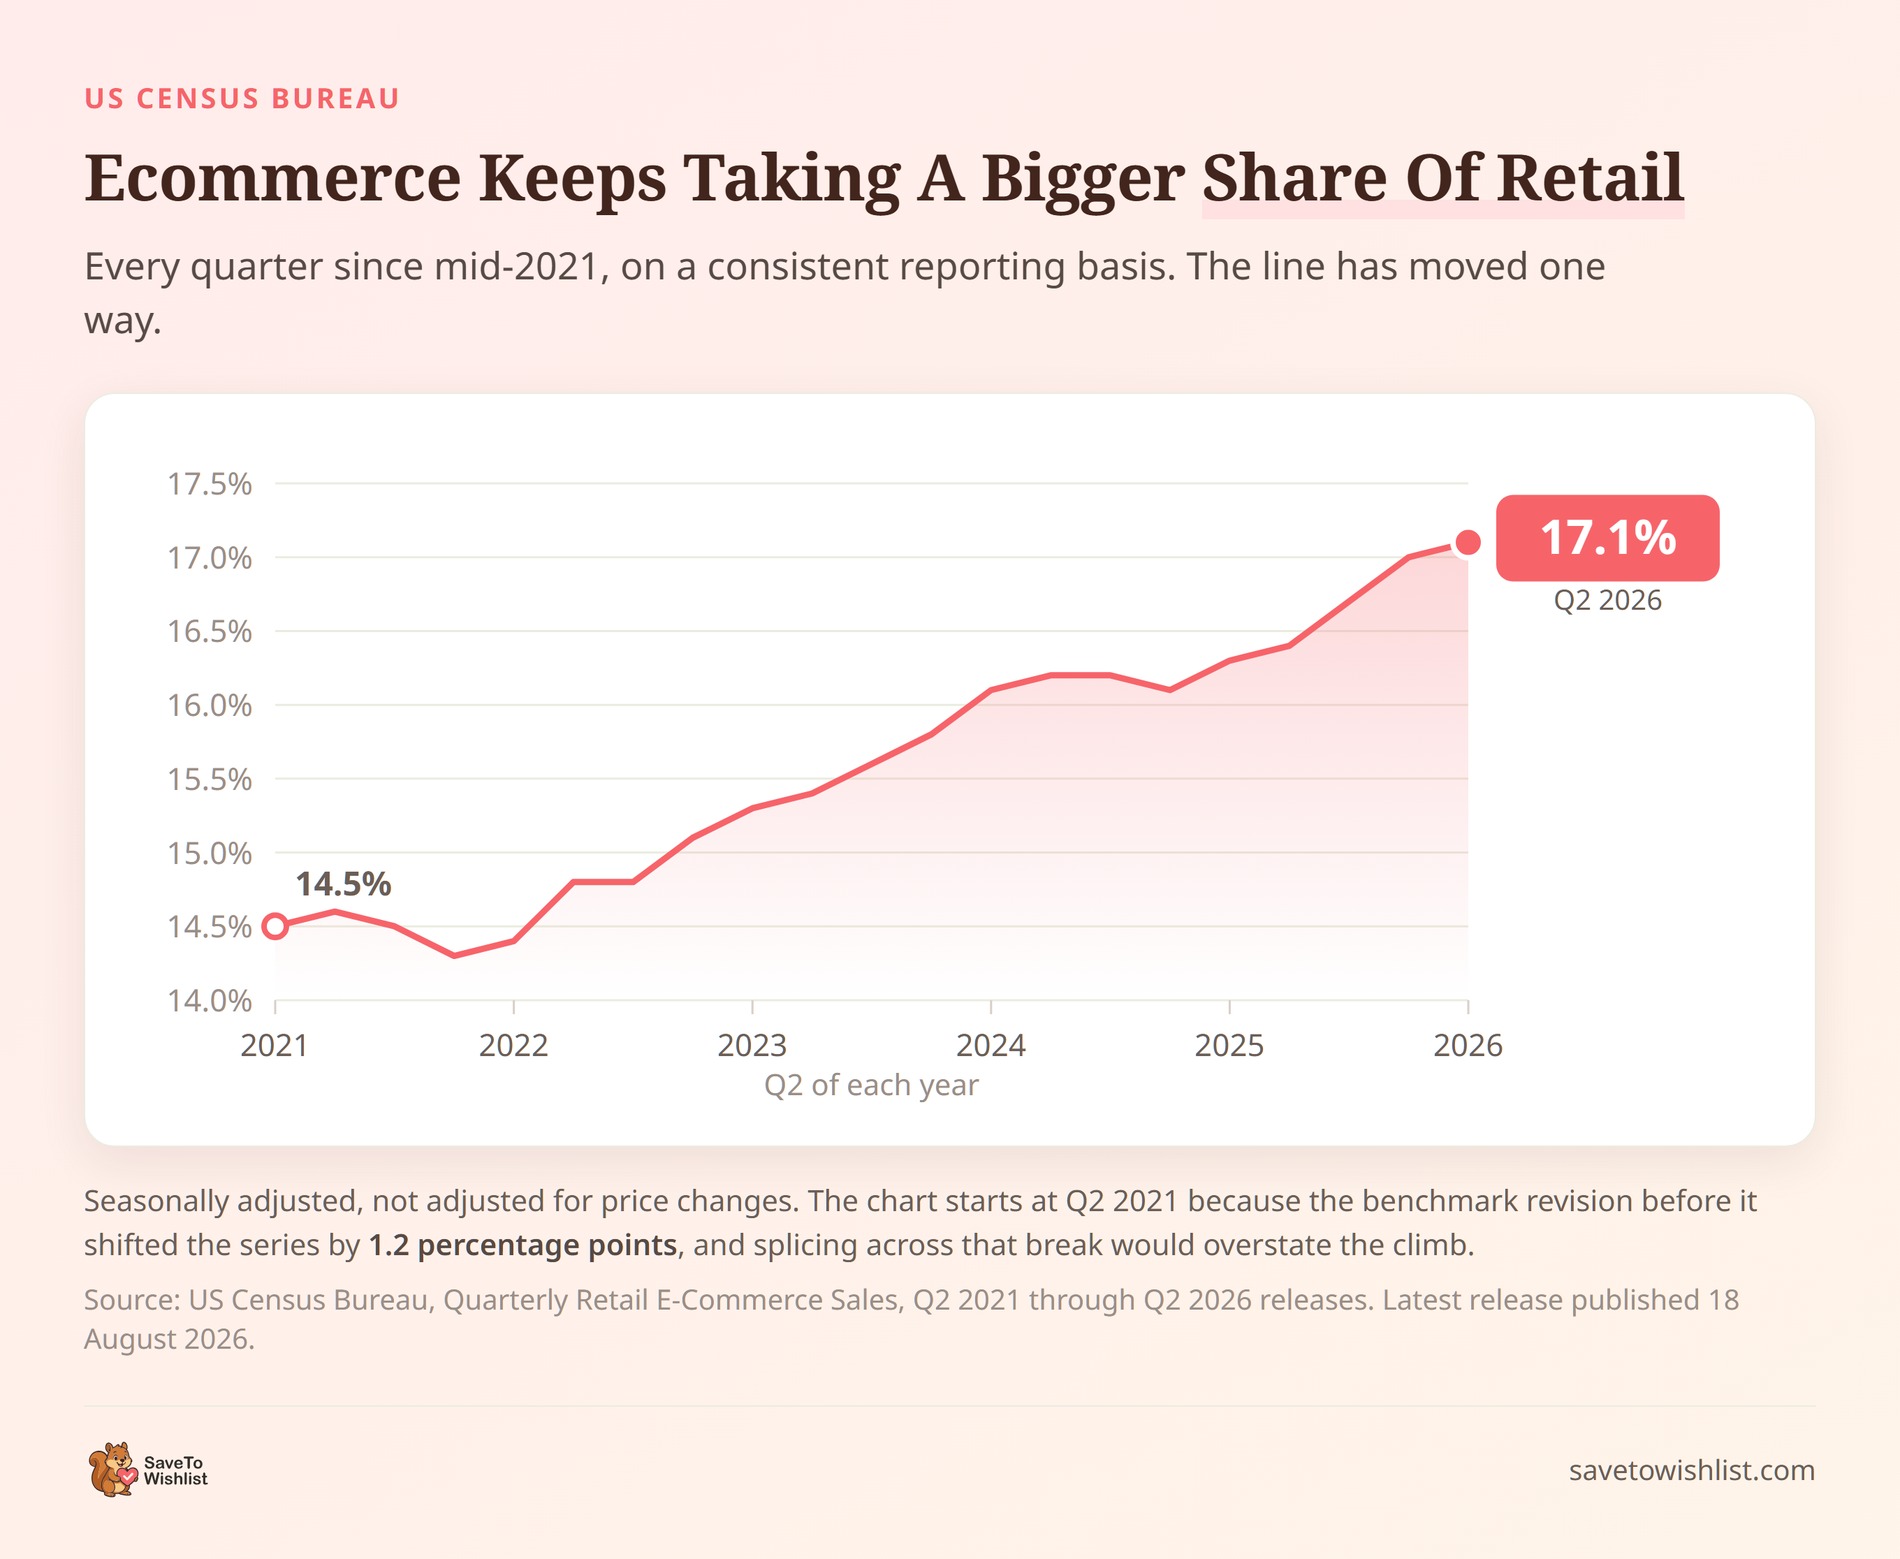
- Ecommerce share of retail: Ecommerce hit 17.1% of total US retail sales in the second quarter of 2026. That comes from the Census Bureau’s Quarterly Retail E-Commerce Sales report.
- Ecommerce growth rate: That same release estimated Q2 2026 ecommerce sales at $340.2 billion, up 12.2% year over year. Total retail grew 6.7% over the same period.
What the occasion numbers actually tell you
Two million weddings and 3.6 million births a year describe how many shoppers have a reason to build a registry. They do not describe how many merchants need registry software. That gap is worth being blunt about, because a lot of registry marketing blurs the two.
Big general retailers and standalone registry websites absorb most of that consumer demand. So the opening for an independent WooCommerce store is narrower. It is the couples and families who already want your catalog. Right now they have to route their guests somewhere else to buy from it.
Registry Adoption And Shopper Behavior
Researchers measure saving behavior far better than registry behavior. The save is the step a registry builds on top of. This is where the most useful research sits.
The Baymard Institute ran a quantitative study of 1,193 respondents. Baymard published its product page research in October 2023 and last revised it in March 2026.
- Reliance on save features: 21% of the 1,193 respondents said they rely on “Save” features to hold products. The majority use the cart as temporary storage instead.
- How badly sites handle it: Baymard gives its finding on the same behavior a blunt title. It reads “Make It Easy to Access and Use ‘Save’ Features (89% Don’t)”. That means 89% of the ecommerce sites they benchmarked fail on it.
- Browsing rather than buying: 42% of US online shoppers gave one particular reason for abandoning a cart. It was “I was just browsing / not ready to buy”. That comes from Baymard’s cart abandonment research.
Baymard also names the causes behind that last figure. It lists window shopping, price comparison, saving items for later and exploring gift options. Baymard calls these ordinary, largely unavoidable reasons a shopper walks away from a cart.
Gift research showing up inside cart abandonment data is not a rounding error. It is a distinct shopping mode, and nobody built the cart to hold it.
Why saving behavior matters more than registry data
A shopper researching gifts behaves nothing like a shopper buying for themselves, and your cart treats them identically. A saved list fixes that mismatch. It gives the gift researcher somewhere to put an item that is not the cart. The intent stays visible instead of dumping into your abandonment rate.
For a smaller store, the 89% figure is the interesting one. Nearly every store handles save functionality poorly, so doing it properly is still a genuine point of difference. A saved list is also zero-party data, given deliberately rather than inferred.
What Guests Reach For When There Is No List
A registry is not competing against nothing. It competes with the gift card, and the gift card is popular for a reason worth understanding.
The same NRF holiday survey that produced the spending figures above also asked people what they want to receive.
- Top requested gift: Gift cards led the list at 50%, ahead of clothing or accessories at 46%. The source is the National Retail Federation.
- The rest of the ranking: Books and other media followed at 27%. Personal care or beauty items took 23%, and electronics 22%.
- Sample: 8,247 adult consumers, surveyed 1 to 7 October 2025. The margin of error was plus or minus 1.1 percentage points.
Half of recipients naming a gift card is worth sitting with. It suggests the giver’s real difficulty is not generosity or budget. It is not knowing what to buy. Wholesale Suite has holiday promotion ideas built around that problem, including gift guides.
Why this argues for a registry rather than against one
A gift card resolves the giver’s uncertainty by handing the decision back to the recipient. Whichever retailer issued the card keeps the money.
A registry resolves the same uncertainty from the other direction. The recipient has already chosen, so the giver gets that confidence without doing any guesswork.
The practical test is effort. If choosing from a list takes longer than buying a card, convenience decides it. The list then loses a guest it had already won.
What A Registry Is Worth To The Store
No primary source publishes a figure for average registry value. Any article that hands you one is repeating something it cannot back up. What I can source is the abandonment cost a registry aims to reduce. The per-person gift spend flowing through gifting occasions has a source too.
- Cart abandonment baseline: Baymard Institute calculates an average documented online cart abandonment rate of 70.22%, derived from 50 separate studies. Baymard last updated the list on 22 September 2025.
- Per-person gift spending: Consumers planned to spend $890.49 per person on the winter holidays. Gifts for family and friends account for $627.93 of that. The source is the National Retail Federation’s annual consumer survey with Prosper Insights & Analytics. The federation published it on 16 October 2025.
🔍️ What we’ve seen: Store owners underestimate how much of a registry’s value is referral traffic. The registry order itself is the smaller part. One event page reaches dozens of people who have never heard of the store. A share of them browse well beyond the list they came for. Measured only by registry-line revenue, the feature looks marginal. Measured by what those first-time visitors do next, it looks very different.
Reading the value figures honestly
Treat the 70.22% as backdrop, not target. A registry does not lower your abandonment rate directly. It moves the gift researcher out of the cart and into a list you can follow up on. That shopper was never going to buy in the session anyway.
The NRF split matters too. Roughly 70% of planned holiday spend is gifts for other people. So in a gift-friendly catalog, someone other than the end user spends most of the peak-season money. Anything that helps that buyer choose correctly is working on the larger share of the basket.
What Returns Data Says About The Wrong Gift
A registry exists to prevent the duplicate and the unwanted gift. Returns data is the closest proxy for both, and it is current.
The National Retail Federation publishes an annual returns study with Happy Returns, a UPS company. The 2025 edition is the most recent.
- Returns as a share of sales: Retailers estimated that customers would send back 15.8% of their annual sales in 2025. That is worth $849.9 billion, per the 2025 Retail Returns Landscape (published 15 October 2025).
- Online runs higher than the average: Retailers expected customers to send back 19.3% of online sales. All channels together ran at 15.8%.
- The holiday rate: Retailers expected 17% of holiday season sales to come back, in line with previous years.
- Who actually answered: The retailer figures come from 358 ecommerce professionals at US merchants above $500 million in revenue. A separate consumer sample covered 2,006 people who had returned an online purchase in the previous year.
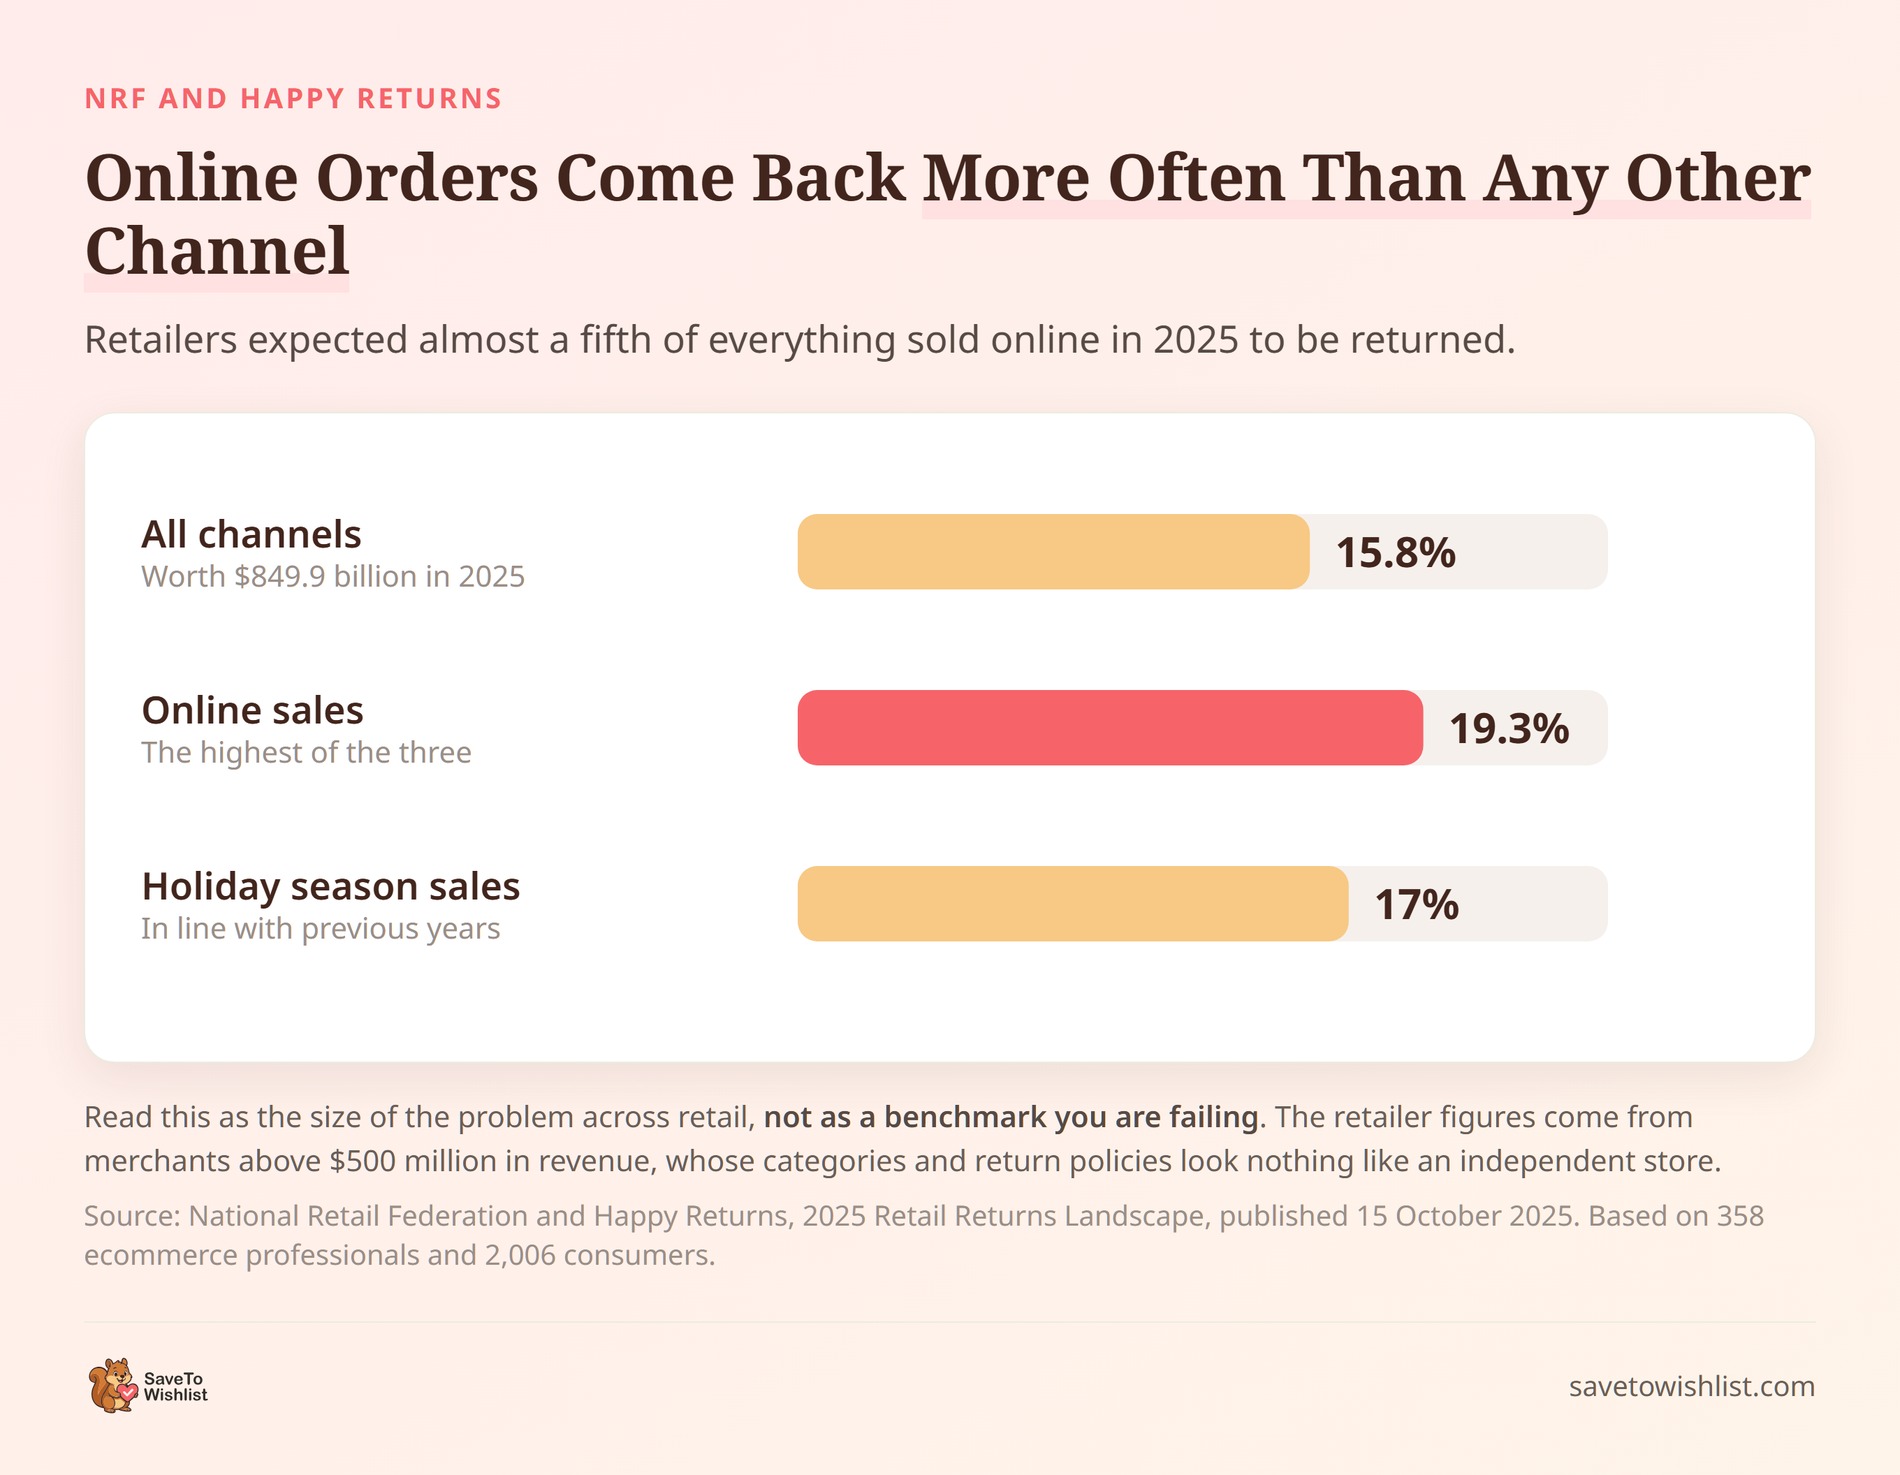
🔍️ What we’ve seen: People quote the 15.8% headline at small store owners as a benchmark they are failing. It is not one. Those retailer figures come from merchants above $500 million in revenue. Their return policies, categories and customer mix look nothing like an independent store’s. Use the number to size the issue across retail. Then measure your own rate before deciding where you stand.
What a registry can and cannot fix
Returns split into causes a list can influence and causes it cannot. Sizing, fit, damage in transit and a simple change of mind all sit outside its reach.
What it does address is narrower. The duplicate and the item the recipient never wanted are the two failures a shared list exists to prevent.
So the honest framing is a slice of that return rate, not the whole of it. No publisher reports how large that slice is. That is why it appears in the unsourced list below rather than in the table.
When Registry Purchases Actually Happen
No primary source I could find publishes registry-specific purchase timing. Publishers do cover holiday gift timing, and it is the closest analogue we have. So read it as gift-buying rhythm rather than registry data. Advanced Coupons has nine ways to boost holiday sales in that same window.
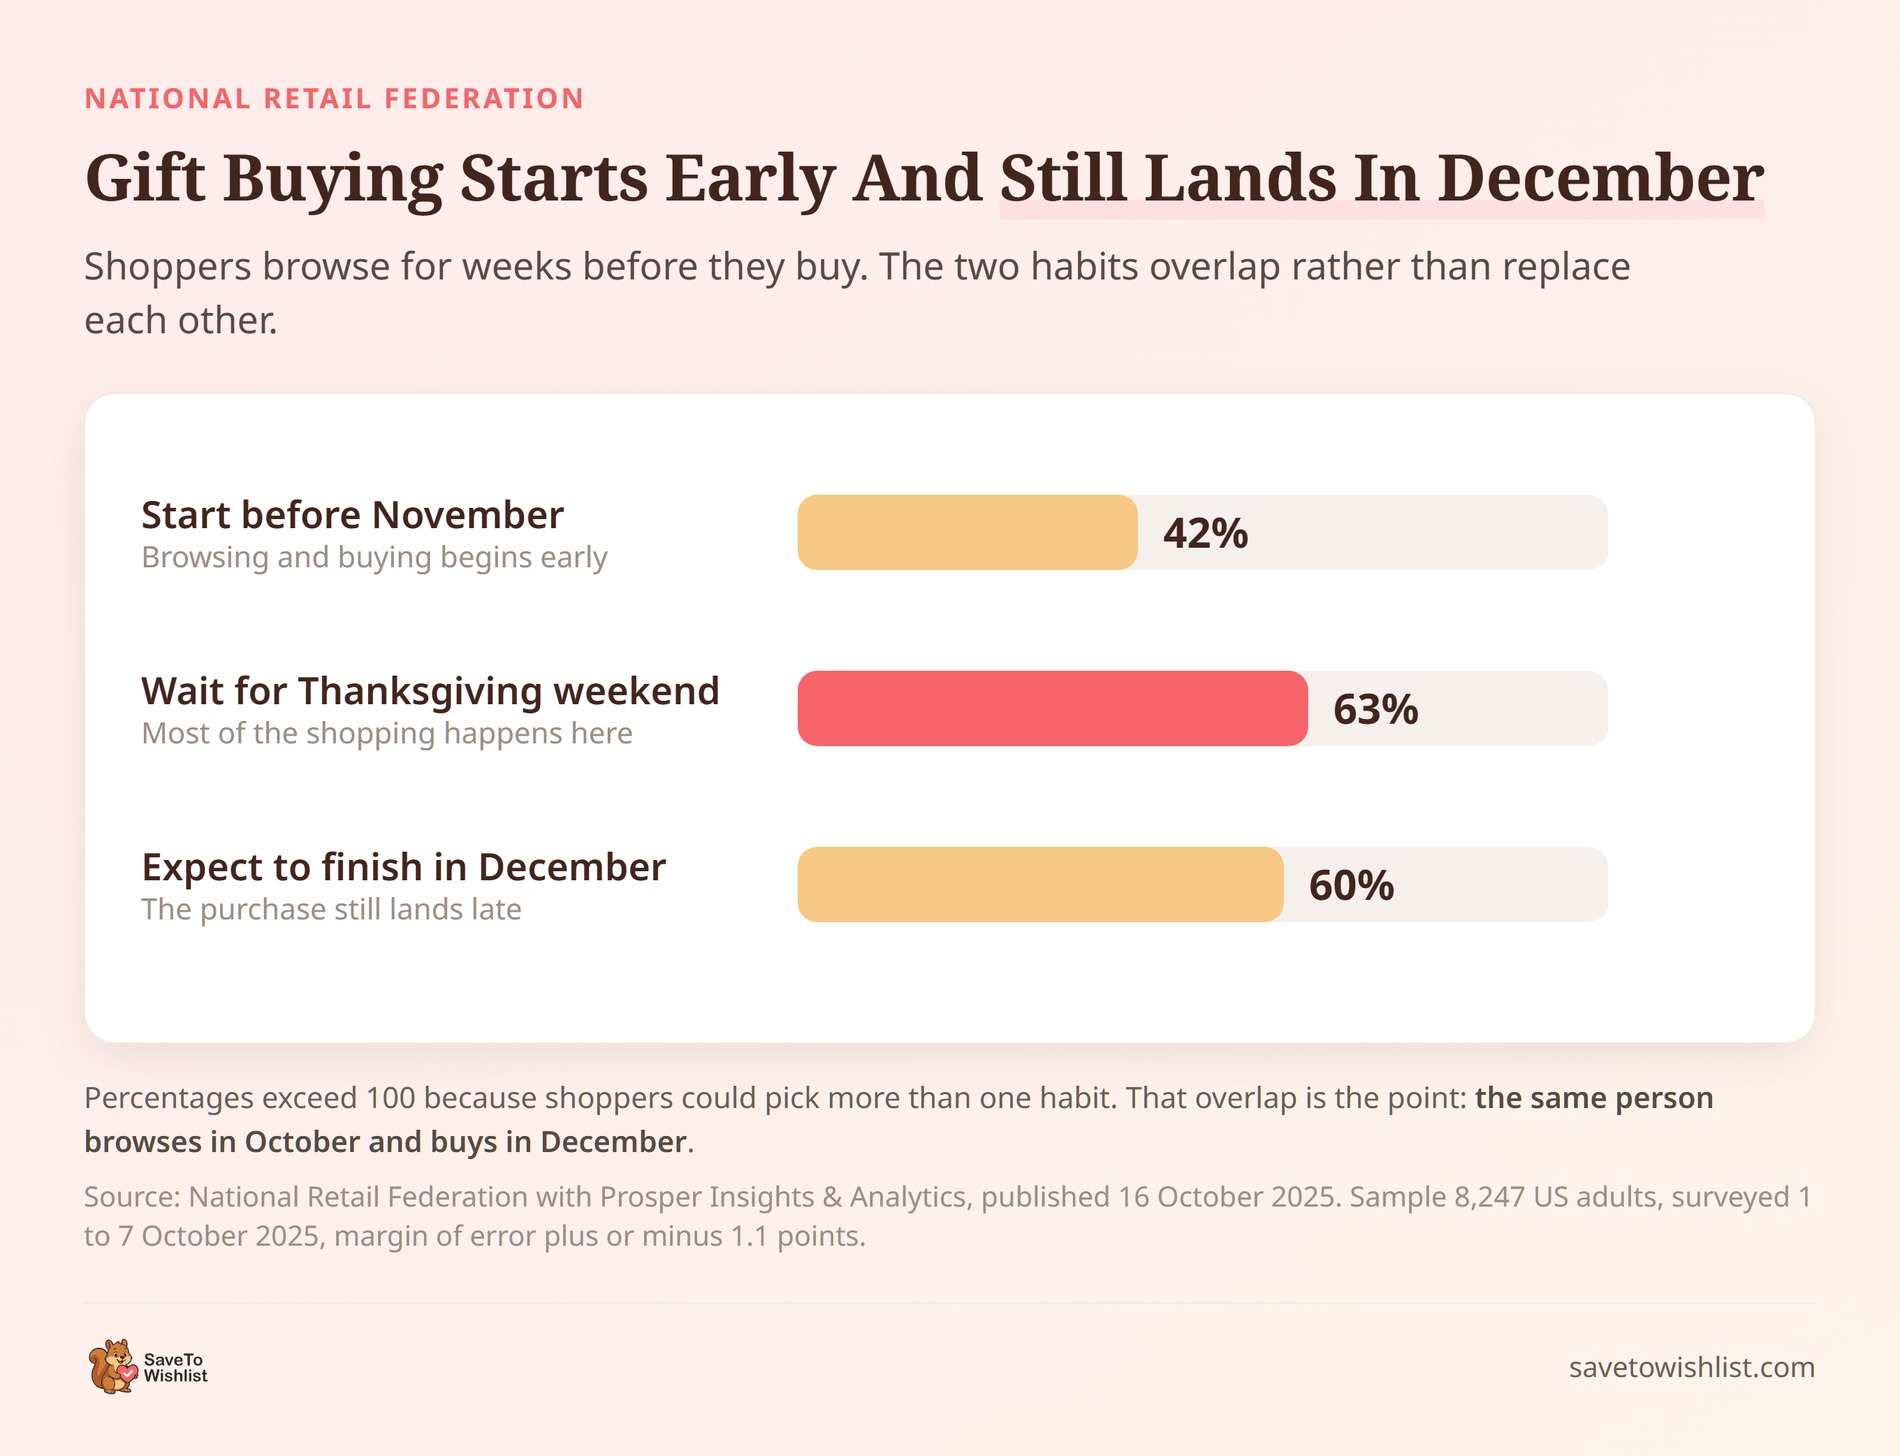
- Early starters: The National Retail Federation found 42% of shoppers planned to start browsing and buying before November. Another 63% planned to wait until Thanksgiving weekend for most of their shopping. A further 60% expected to finish in December (October 2025).
- December concentration online: Electronic shopping and mail-order houses recorded $146.6 billion in sales in December 2024. That was the highest monthly total of the year. The source is the Census Bureau’s 2025 Winter Holiday Season release (16 December 2025).
- December concentration in gift categories: That same release put 13.7% of 2024 hobby, toy and game store sales in December.
Planning around the browse-to-buy gap
Weeks, sometimes months, separate browsing from buying. That gap is the operational argument for a list. Something has to hold the intent between the research session and the purchase. A cart does not survive that long.
December concentration also tells you when a registry turns into a support problem rather than a marketing one. Stock, shipping cutoffs and duplicate-gift handling come under pressure in the same fortnight. That is exactly when automatic purchase tracking earns its place. AdTribes covers ecommerce product discovery for shoppers hunting gifts in December.
What These Numbers Mean For A WooCommerce Store
Put the verified figures side by side and a fairly simple picture appears. Gift-driven shopping is a large, measurable share of retail. Saving behavior is common, site support for saving is poor, and the buying happens well after the browsing.
None of that says the consumer registry market is available to you. It says the behavior is real and mostly unserved on independent stores. Only the second claim is something a WooCommerce store can act on.
Three things follow:
- Capture the save before the cart. The gift researcher is already sitting in your abandonment numbers. Giving them a list is how they stop being anonymous.
- Plan for a shared audience. A registry link lands in front of people who have never visited your store, so that page is doing first-impression work.
- Automate duplicate prevention. Purchase tracking is the difference between a registry that reduces admin and one that creates it.
For the practical setup rather than the data, we cover how to set up a gift registry step by step. We also cover the difference between a shared list and a collaborative wishlist. Pre-cart capture is in our guide to browse abandonment.
How To Measure Registry Performance In Your Store
Everything above is industry backdrop. The numbers that decide whether a registry works for you have to come from your own store.
WooCommerce has recorded order attribution on every order since version 8.5. That is enough to answer most of the question without adding any tooling. Visser Labs has a practical guide to your store data for the wider view.
- The Origin column: Your orders list shows an Origin value per order. It reads Referral followed by the referring site, or Organic followed by the search engine. A campaign value shows as Source, and typed or untracked visits show as Direct. Web admin marks orders you create yourself, and Unknown means WooCommerce captured nothing.
- The entry page: Attribution stores the page a visitor landed on to begin the session. Registry URLs appear here, which is what separates guests who arrived through a shared list from everyone else.
- Pages per session: The order also carries the number of pages that visitor viewed in the session. This is the figure that shows whether a registry guest browsed past the list they came for.
- Visit count: WooCommerce records a returning visitor’s session number as well. So a guest who comes back later and buys for themselves stays visible on the order.
The three numbers worth tracking
Start by separating what a registry guest bought in total from what they bought off the list itself. Attribution gives you the first figure. You already have the second. Pulling both together is easier once you export your orders.
Next, compare pages per session for registry arrivals against your site average. A higher number is the referral effect turning up as data instead of as a hunch.
Last, count how many registry guests come back on a later session. That figure tells you whether an event page recruited anybody. It takes a full season to read properly.

Methodology And Sources
Every figure on this page had to clear three tests. It comes from the organization that produced the data. I fetched the URL and confirmed it carried the figure in August 2026. The publisher states the date.
I did not accept roundups, content-mill articles or vendor marketing pages as sources. That held even where they were the only place a number appeared.
The 18 figures and where each one comes from
| # | Statistic | Figure | Source | Date |
|---|---|---|---|---|
| 1 | US marriages | 2,041,926 | CDC / NCHS FastStats | Provisional 2023 |
| 2 | US births | 3,606,400 | CDC / NCHS | 2025, published Apr 2026 |
| 3 | Median age at first marriage | 30.8 men, 28.4 women | US Census Bureau | 2025 |
| 4 | Married-couple share of households | 47% | US Census Bureau | 2025 |
| 5 | Ecommerce share of US retail sales | 17.1% | US Census Bureau | Q2 2026 |
| 6 | US ecommerce sales, quarterly | $340.2bn, +12.2% YoY | US Census Bureau | Q2 2026 |
| 7 | Shoppers who rely on “Save” features | 21% of 1,193 | Baymard Institute | 2023, revised 2026 |
| 8 | Sites failing to make “Save” easy | 89% | Baymard Institute | 2023, revised 2026 |
| 9 | Abandoned because “just browsing” | 42% | Baymard Institute | Current list |
| 10 | Average cart abandonment rate | 70.22% | Baymard Institute | Updated Sep 2025 |
| 11 | Planned winter holiday spend per person | $890.49 | NRF / Prosper Insights | Oct 2025 |
| 12 | Of which, gifts for family and friends | $627.93 | NRF / Prosper Insights | Oct 2025 |
| 13 | Holiday shopping timing | 42% pre-November, 63% Thanksgiving weekend, 60% finish in December | NRF / Prosper Insights | Oct 2025 |
| 14 | December share of online and gift-category sales | $146.6bn electronic shopping; 13.7% of toy and game sales | US Census Bureau | Dec 2025 release, 2024 data |
| 15 | Returns as a share of annual sales | 15.8%, $849.9bn | NRF / Happy Returns | Oct 2025 |
| 16 | Online sales returned | 19.3% | NRF / Happy Returns | Oct 2025 |
| 17 | Holiday sales expected to be returned | 17% | NRF / Happy Returns | Oct 2025 |
| 18 | Most requested gift to receive | Gift cards, 50% | NRF / Prosper Insights | Oct 2025 |
What could not be sourced
This part matters as much as the table. Plenty of articles quote the figures below, and I left every one of them out, because no primary publisher stands behind them.
- Average value of a wedding registry. Every trail ended at a registry platform’s own marketing or at a blog citing one. Those platforms sell the service this article’s readers are an alternative to, so their figures are not neutral.
- Registry completion rate. No neutral publisher reports what share of registry items guests actually buy.
- Share of couples who create a registry. Platform surveys do report this, but they draw their sample from people already using a registry service. That population cannot tell you how common registries are among couples generally.
- Number of registries created per year, on any platform. Nobody publishes this.
- Share of returns caused by duplicate or unwanted gifts. Publishers report returns in aggregate. No breakdown isolates the gift-specific causes a registry is able to address.
- US wedding services market size. Statista’s series on wedding services revenue ends at 2013 and sits behind a subscription. It fails both the currency and the accessibility test.
- Household spend on gifts for people outside the household. The Bureau of Labor Statistics dropped gifts from the Consumer Expenditure Survey’s standard tables. That applies from the 2020 midyear release onward. The data exists on request, but there is no live URL to cite.
Do you have a primary-sourced figure for any of the above? We would genuinely like to see it, and we will add it here with attribution.
Frequently Asked Questions: Gift Registry Statistics
How big is the gift registry market?
No organization publishes a credible market-size figure for gift registries, which is why this article does not quote one. The closest defensible framing uses occasion volume and ecommerce share.
That means roughly 2.04 million US marriages (CDC, provisional 2023) and 3.6 million US births in 2025 (CDC). It also means ecommerce at 17.1% of total US retail sales in Q2 2026 (Census Bureau). Those describe consumer demand, not merchant demand for registry software.
Are gift registry statistics the same as wedding statistics?
No, and conflating them is the most common error in this topic. Wedding statistics describe how many weddings happen and what they cost. Registry statistics would describe how many couples register and what guests actually buy. Government data measures the first category well and the second barely at all.
Why do so many gift registry articles quote the same figures?
Because they are citing each other. A figure appears once without attribution, spreads, and after a few cycles it reads as established fact. Follow the links back and most terminate at another roundup rather than a study. That circularity is why every number here carries a live source link and a date.
What is the most useful statistic here for a store owner?
The 89% figure from Baymard Institute. It describes how many benchmarked ecommerce sites fail to make save features easy to access and use. Market-size numbers do not change what you do on Monday. That one says nearly every store serves a common shopper behavior badly.
Put Gift Registry Statistics To Work In Your Store
What surprised me most while assembling this was how little of the registry conversation anyone measures at all. Researchers document saving, sharing and buying for someone else well. The registry layer sitting on top of them is almost entirely undocumented. So store owners have been making this decision on vibes.
The short version of what to do with the numbers above:
- How Big The Gift Registry Market Actually Is: use occasion volume for scale, never as a proxy for merchant demand.
- Registry Adoption And Shopper Behavior: treat the gift researcher as a distinct shopper.
- What Guests Reach For When There Is No List: assume you are competing with a gift card.
- What A Registry Is Worth To The Store: measure referral traffic, not just registry-line revenue.
- What Returns Data Says About The Wrong Gift: size the duplicate problem before you price a fix for it.
- When Registry Purchases Actually Happen: build for a browse-to-buy gap of weeks.
- How To Measure Registry Performance In Your Store: use order attribution to see what registry guests actually did.
- Methodology And Sources: check where a figure comes from before you plan around it.
What the Gift Registry Addon actually does
SaveTo Wishlist Lite is the free wishlist plugin and SaveTo Wishlist Pro is the paid extension. The Gift Registry Addon ships with the Plus and Business plans only, not with Growth.
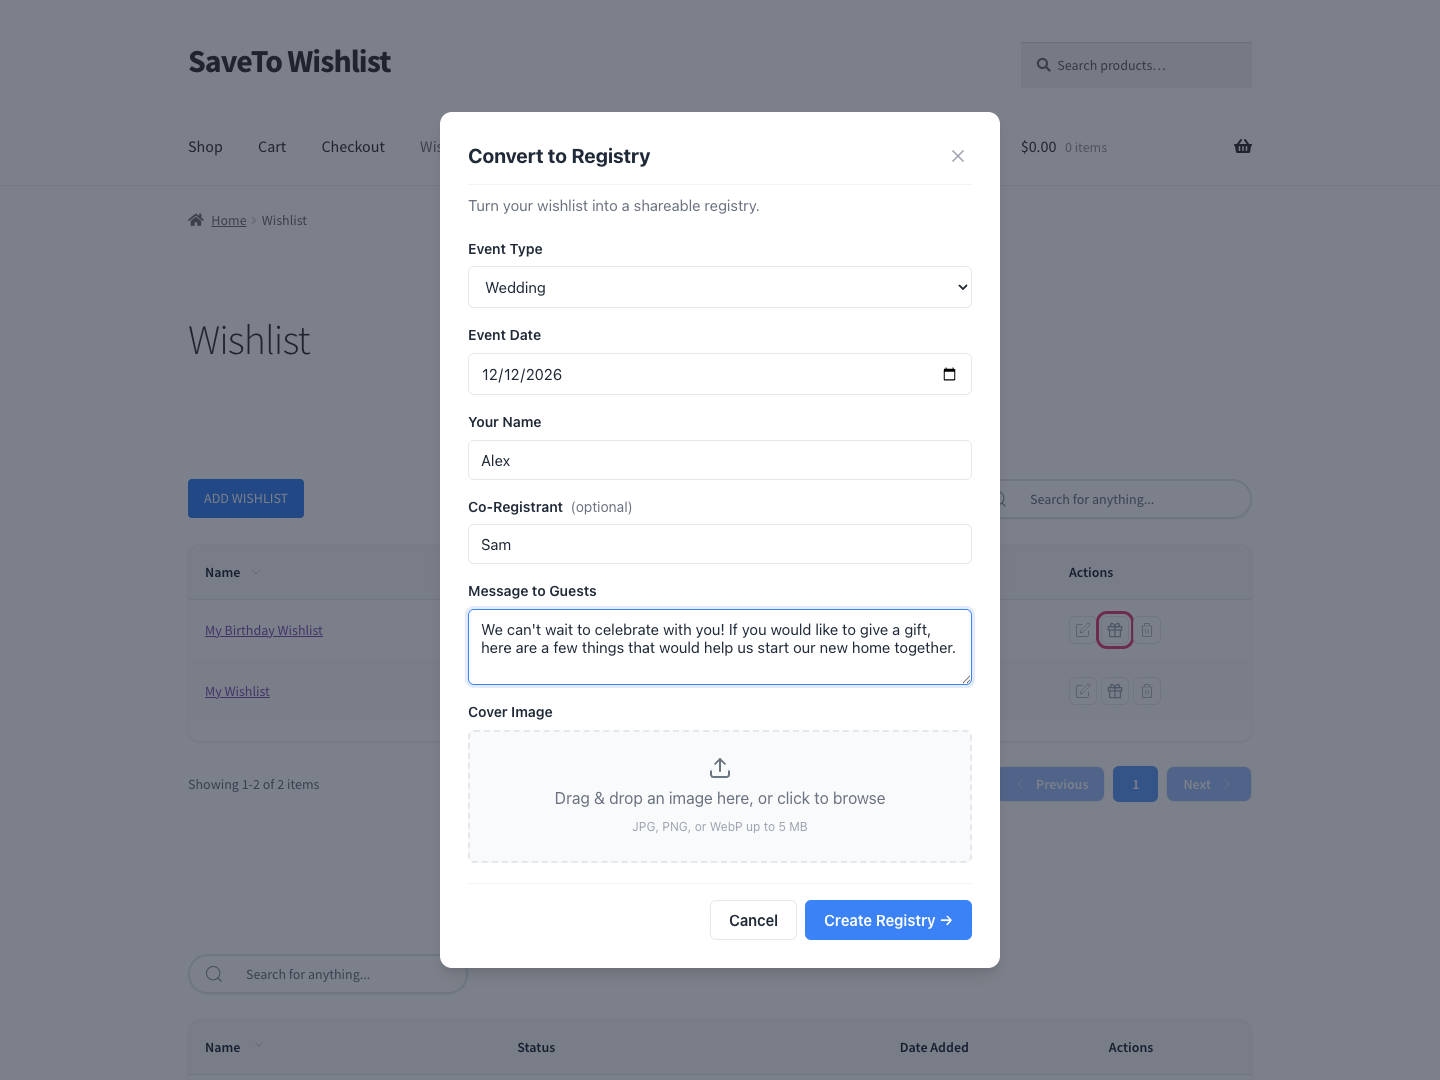
The addon turns an existing wishlist into a registry through a short form. That form captures the event type, date, registrant name and an optional cover image.
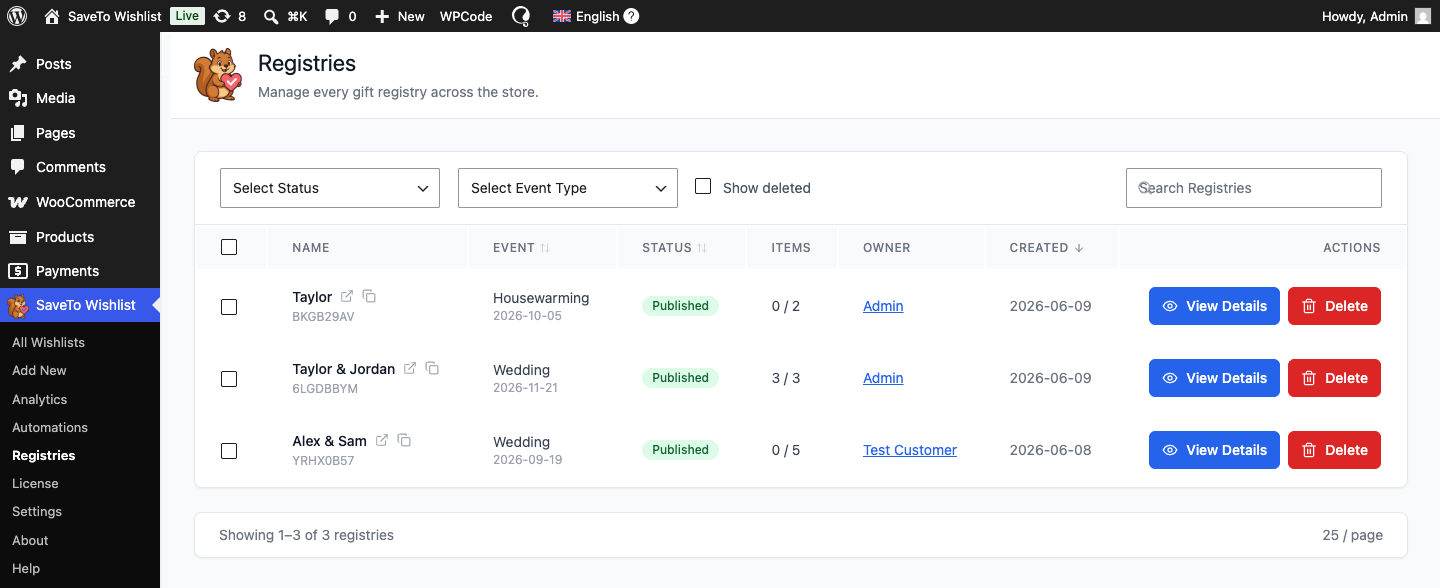
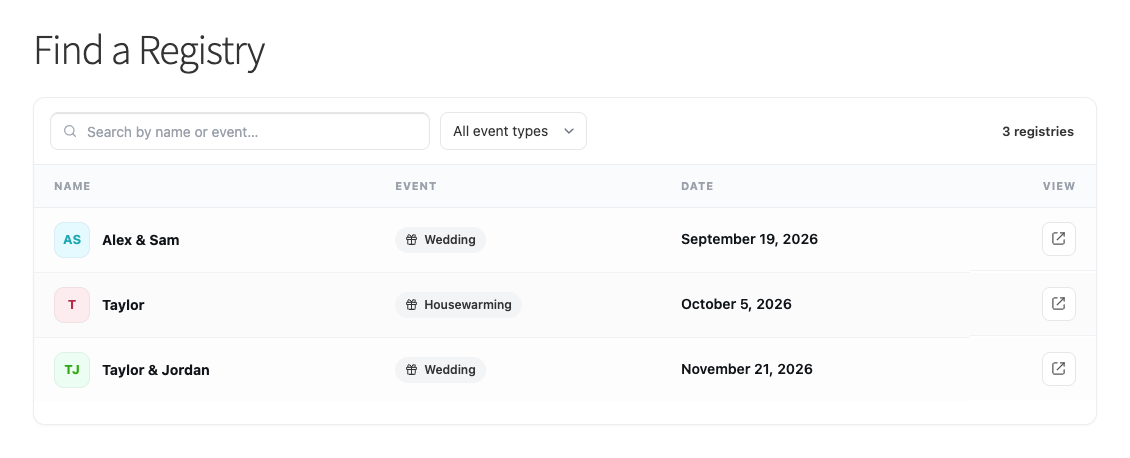
It adds a Gift Registries tab to My Account once a customer owns at least one registry. It also publishes a Find a Registry page, where guests search by the registrant’s name and filter by event type. The addon records purchases as orders move into a paid status, so requested item counts adjust and fewer duplicate gifts slip through.
One limitation is worth knowing before you plan around it. Shoppers can save a wishlist as a guest, and you control that with the Disable Guest Wishlist setting. Converting a wishlist into a registry needs a customer account, so a guest has to register first.
Pricing is introductory, so both numbers matter before you buy. Growth is $49.50 for the first year and $99 on renewal. Plus is $99.50 then $199, and Business is $199.50 then $399. There is a 14-day money-back guarantee.
Is your catalog the one people want at their wedding or baby shower? Compare the plans on the pricing page and start with a tier that includes the Gift Registry Addon.