

 Reviewed by
 Every stockout is a sale you turned away. Every overstock is cash sitting on a shelf. Ecommerce demand forecasting is how you avoid both by predicting what customers will buy before they buy it. The trouble is that most forecasting looks only backward, at past sales, and past sales can’t see the demand building right now.
However, there’s a signal most stores overlook: what shoppers are saving. A wishlist is a statement of future intent, a customer telling you “I want this, maybe later.” Aggregate enough of those signals and you get an early read on demand. That’s something sales history alone can’t give you.
In our experience, saved-item patterns often hint at what’s about to sell before the orders arrive. We’ve watched this play out across many WooCommerce stores. This guide covers demand forecasting for ecommerce in practical terms. It also shows how to use wishlist data as a leading indicator alongside your usual methods.
Table Of Contents
- What Is Ecommerce Demand Forecasting?
- Why Past Sales Alone Aren't Enough
- How Wishlist Data Works As A Leading Indicator
- How To Use Saved-Item Data For Inventory Planning
- Keep Your Forecasts Honest
- Your Ecommerce Demand Forecasting Checklist
- Forecast With What Customers Are Telling You
- Frequently Asked Questions
What Is Ecommerce Demand Forecasting?
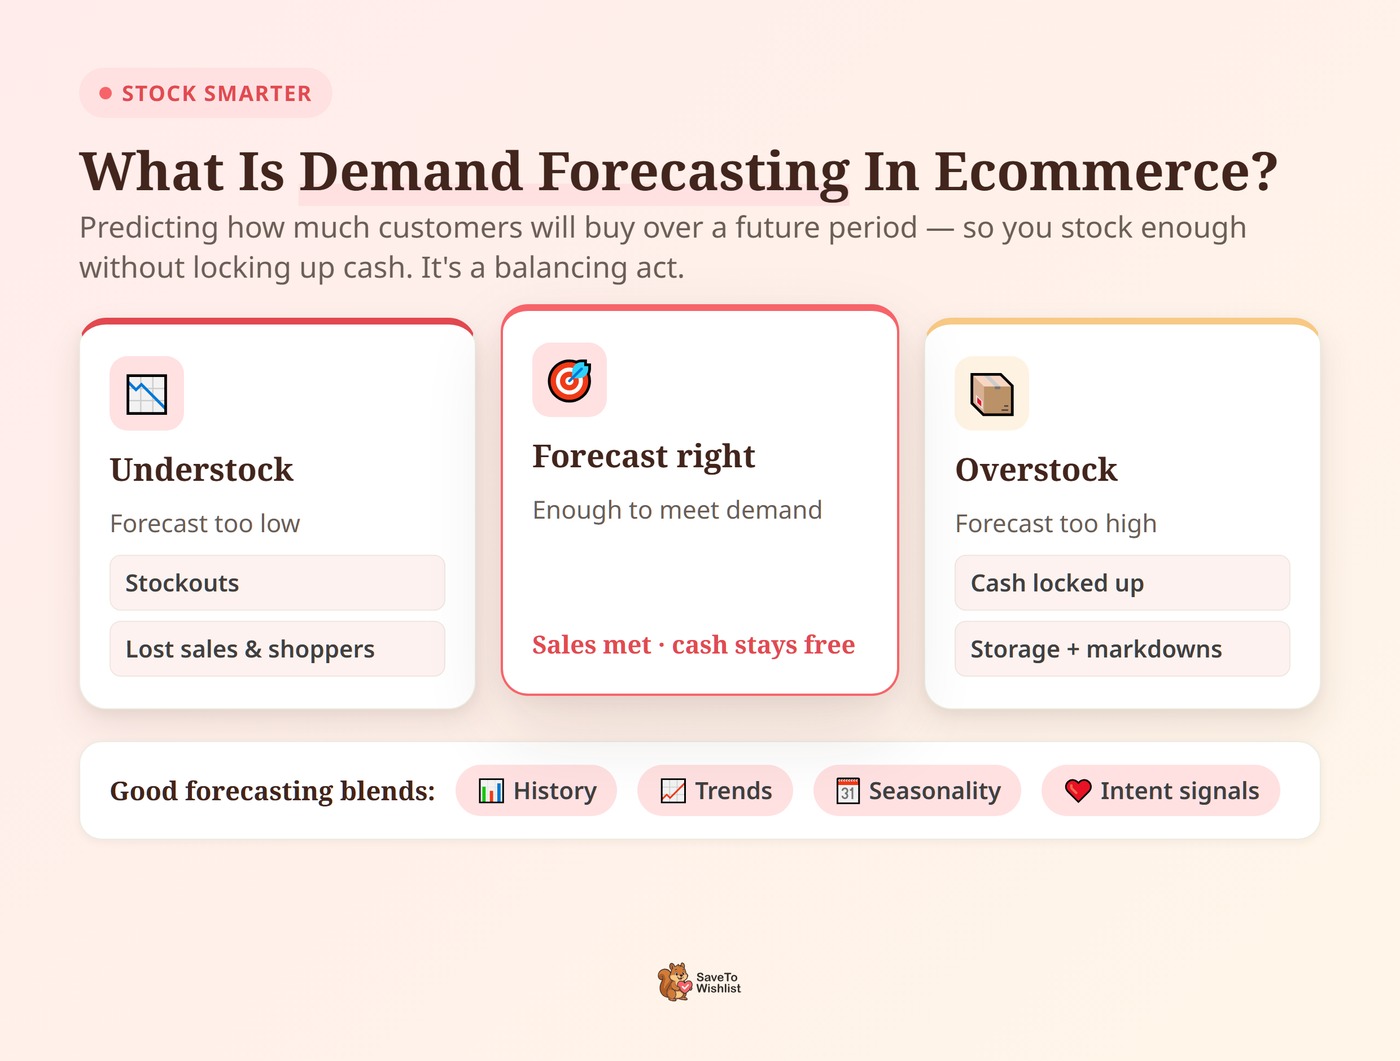
Demand forecasting is simply predicting how much of a product your customers will actually want to buy in the future. Get it right, and you’ll stock just enough to increase customer satisfaction without stressing out your supply chain. You’ll also avoid tying up your hard-earned cash in inventory that just sits there gathering dust.
For any ecommerce business, the stakes are very real:
- If you underestimate demand: You’ll sell out too fast, miss out on easy revenue, and practically hand your frustrated customers over to your competitors.
- If you overestimate demand: You’re stuck with capital locked up in unsold boxes. That means you’ll pay extra for storage space and eventually have to slash your prices just to get rid of it.
Good ecommerce demand forecasting is the balancing act between those two nightmares. In practice, it means blending your past sales history, seasonal trends, and fresh signals about what your customers actually intend to buy next.
Why Past Sales Alone Aren’t Enough
Most ecommerce forecasting leans heavily on historical sales. History is definitely useful, but it has a massive blind spot: it can only tell you what already happened, not what’s building right now.
Think about it. A product you launched last month doesn’t have enough history to forecast from. An item that’s suddenly gaining traction today won’t show up in your sales data until the actual orders land. By that point, you might already be out of stock. If you only rely on the rearview mirror, you’ll always be reacting to demand instead of anticipating it. That puts an incredible amount of unnecessary stress on your supply chain.
🔍️ What we’ve seen: Stores often treat a sudden stockout as bad luck. Yet, the early warning was sitting in their wishlist data for weeks! Shoppers were saving the item faster than usual, clearly signaling a surge. The sales reports only confirmed the trend after it was already too late to restock.
How Wishlist Data Works As A Leading Indicator
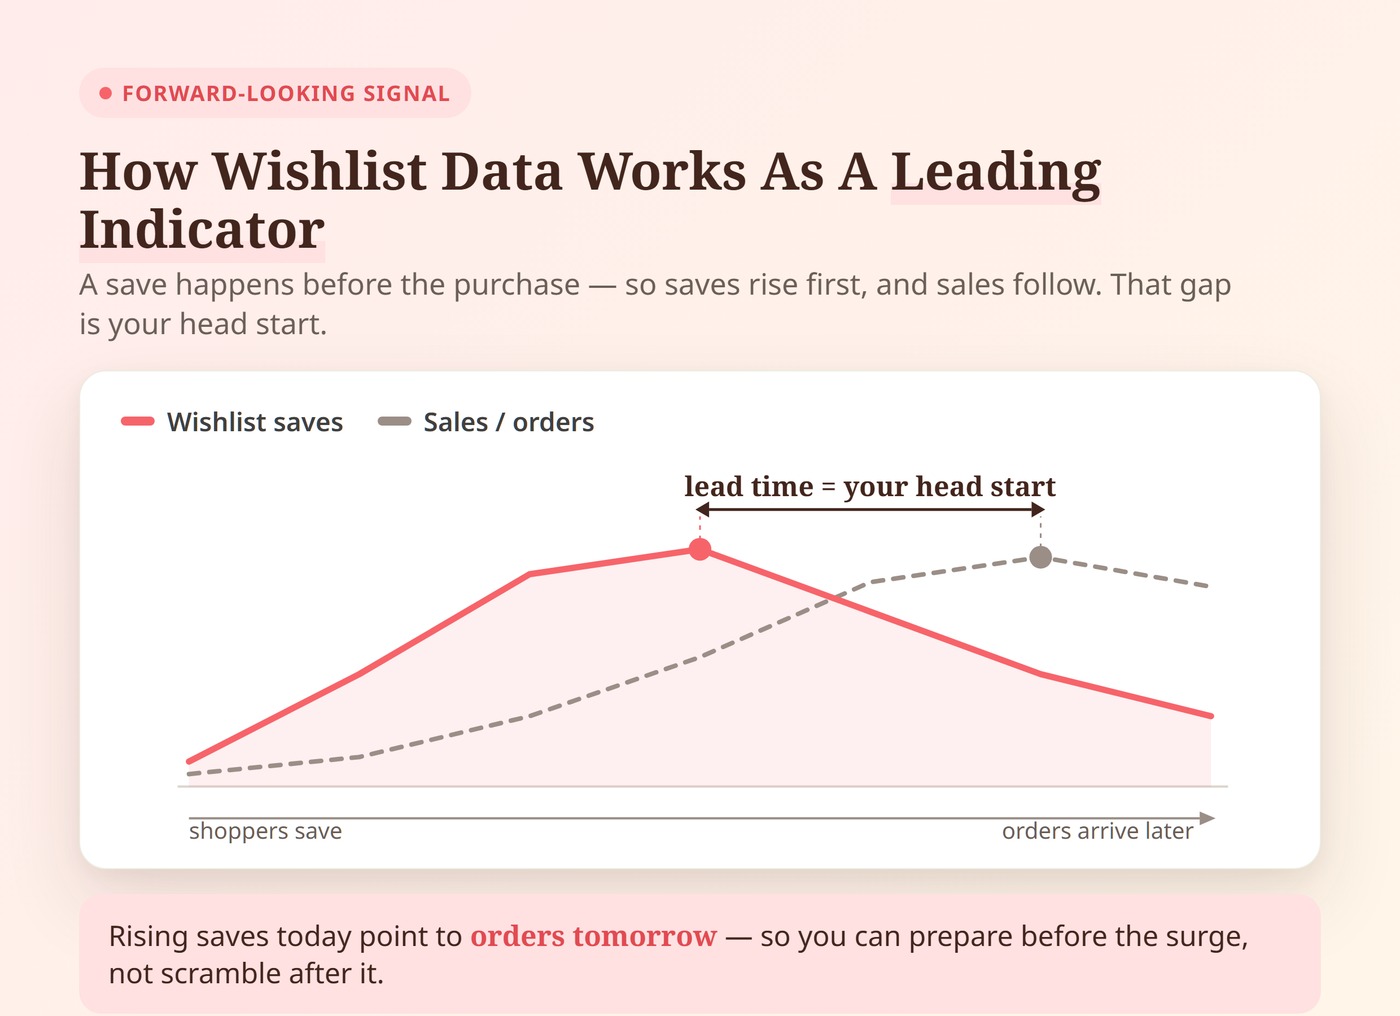
A wishlist save happens before the purchase. That’s exactly what makes it so valuable for forecasting. Instead of looking backward at what already happened, you’re looking forward at what people actually intend to buy.
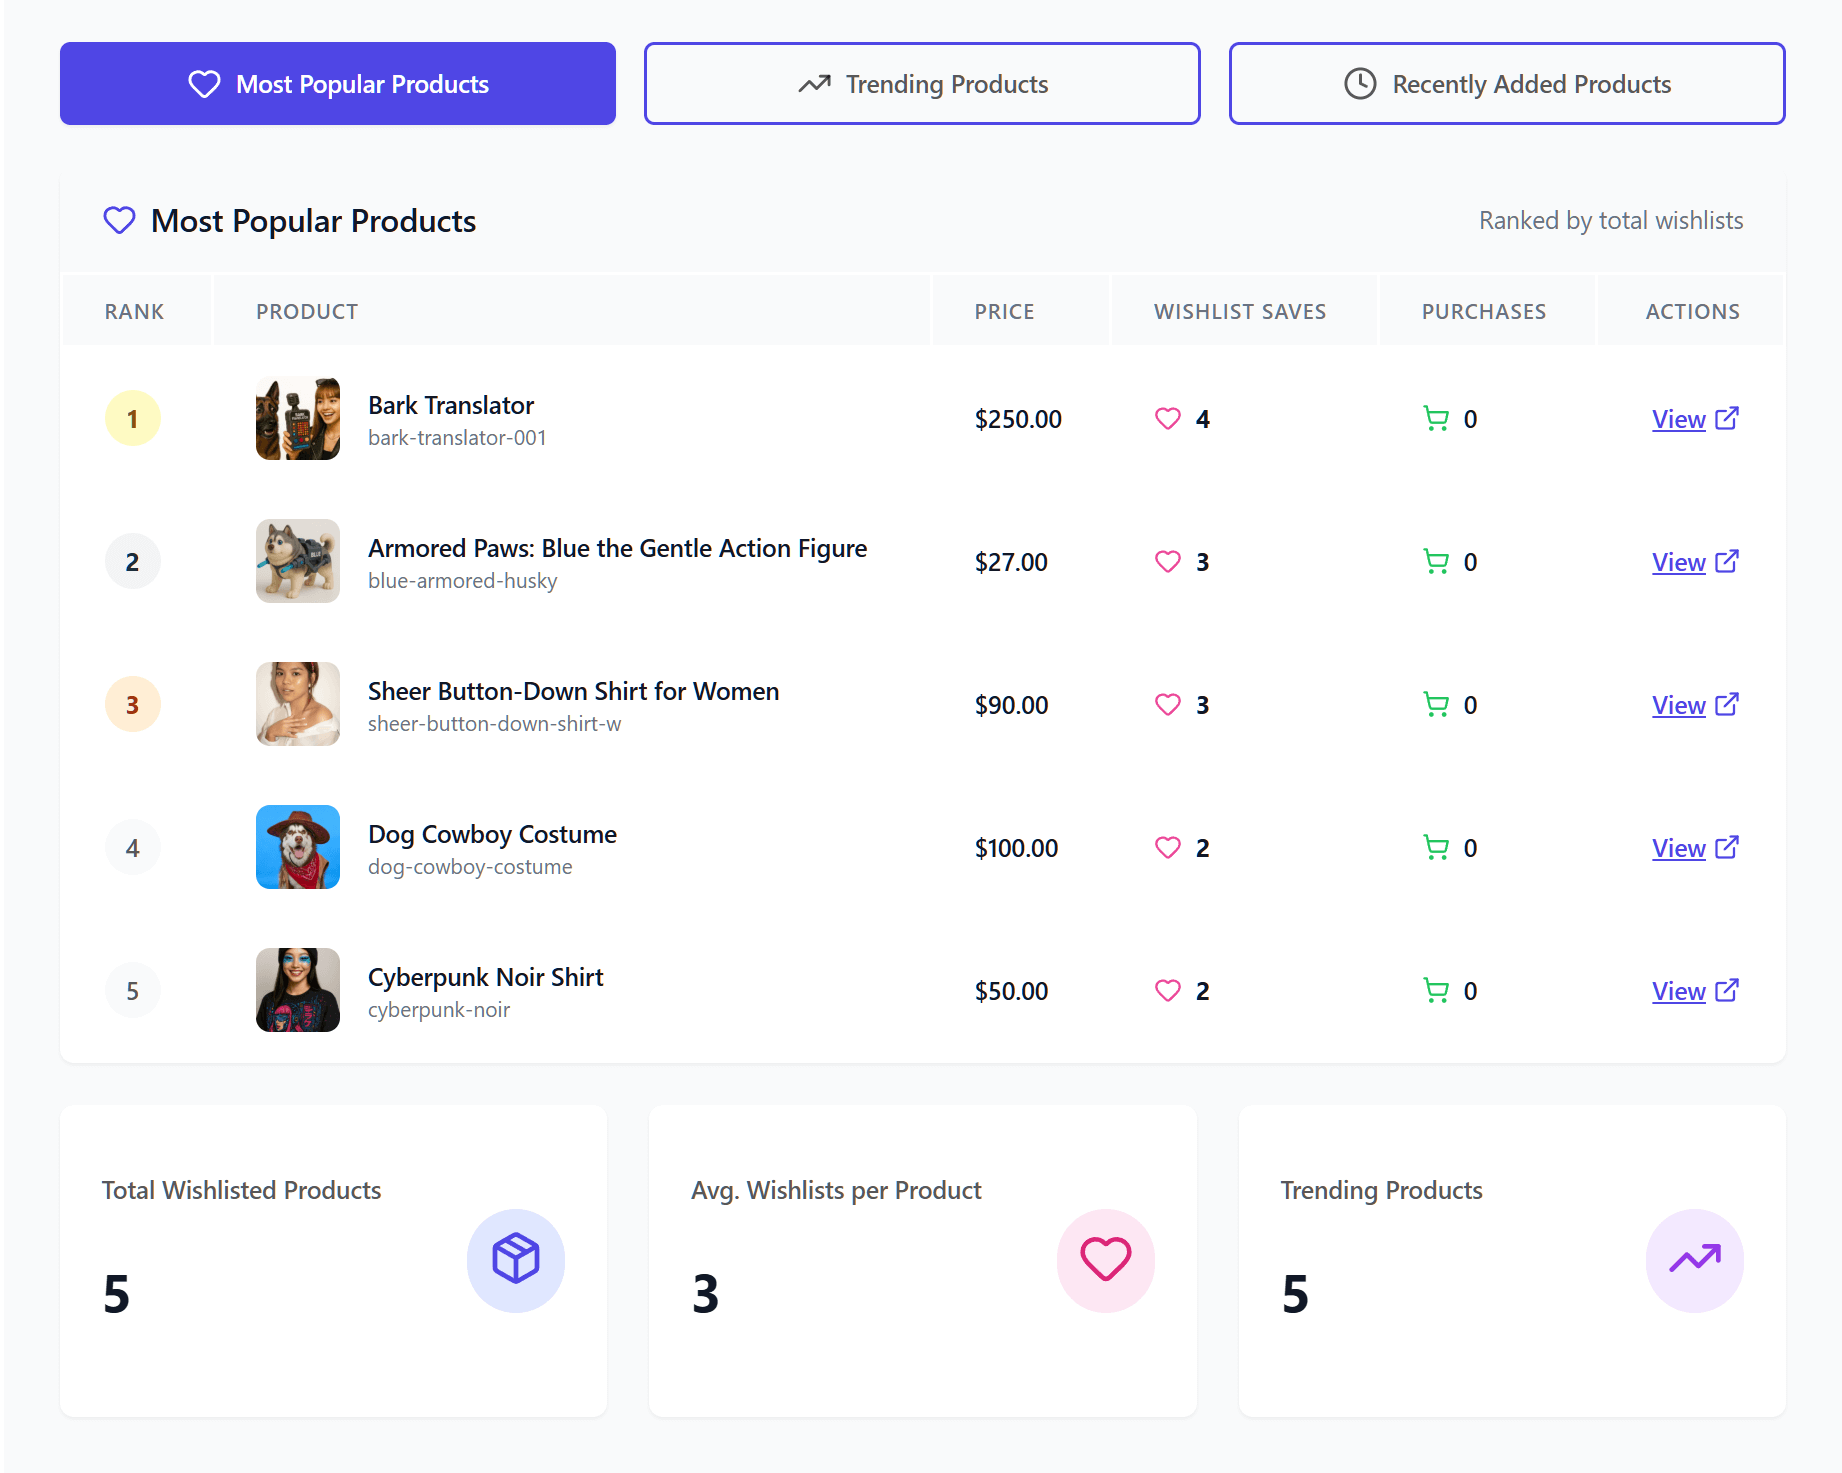
When you look at this data in your dashboard, clear patterns start to emerge. You don’t have to guess anymore. SaveTo Wishlist Pro analytics show you exactly which products are getting saved the most and how long that interest has been sitting there.
Here’s what you’re actually looking for:
- The Fresh Spike: If a product suddenly gets 50 saves in two days, demand is building right now. That’s your early read to prepare a restock.
- The Aging Interest: If an item was saved 100 times last month but nobody is buying it, that interest is getting stale. It’s time to trigger a price-drop alert to clear out your existing stock.
Just remember, this data is a leading indicator, not a crystal ball. A rising save count means interest is building. Thus, it gives you the crucial lead time you need to prepare, especially if it lines up with a season or a big promotion you already have planned.
📝 Note: Our guide on wishlist analytics and customer intent digs into exactly how to read these specific signals.
How To Use Saved-Item Data For Inventory Planning
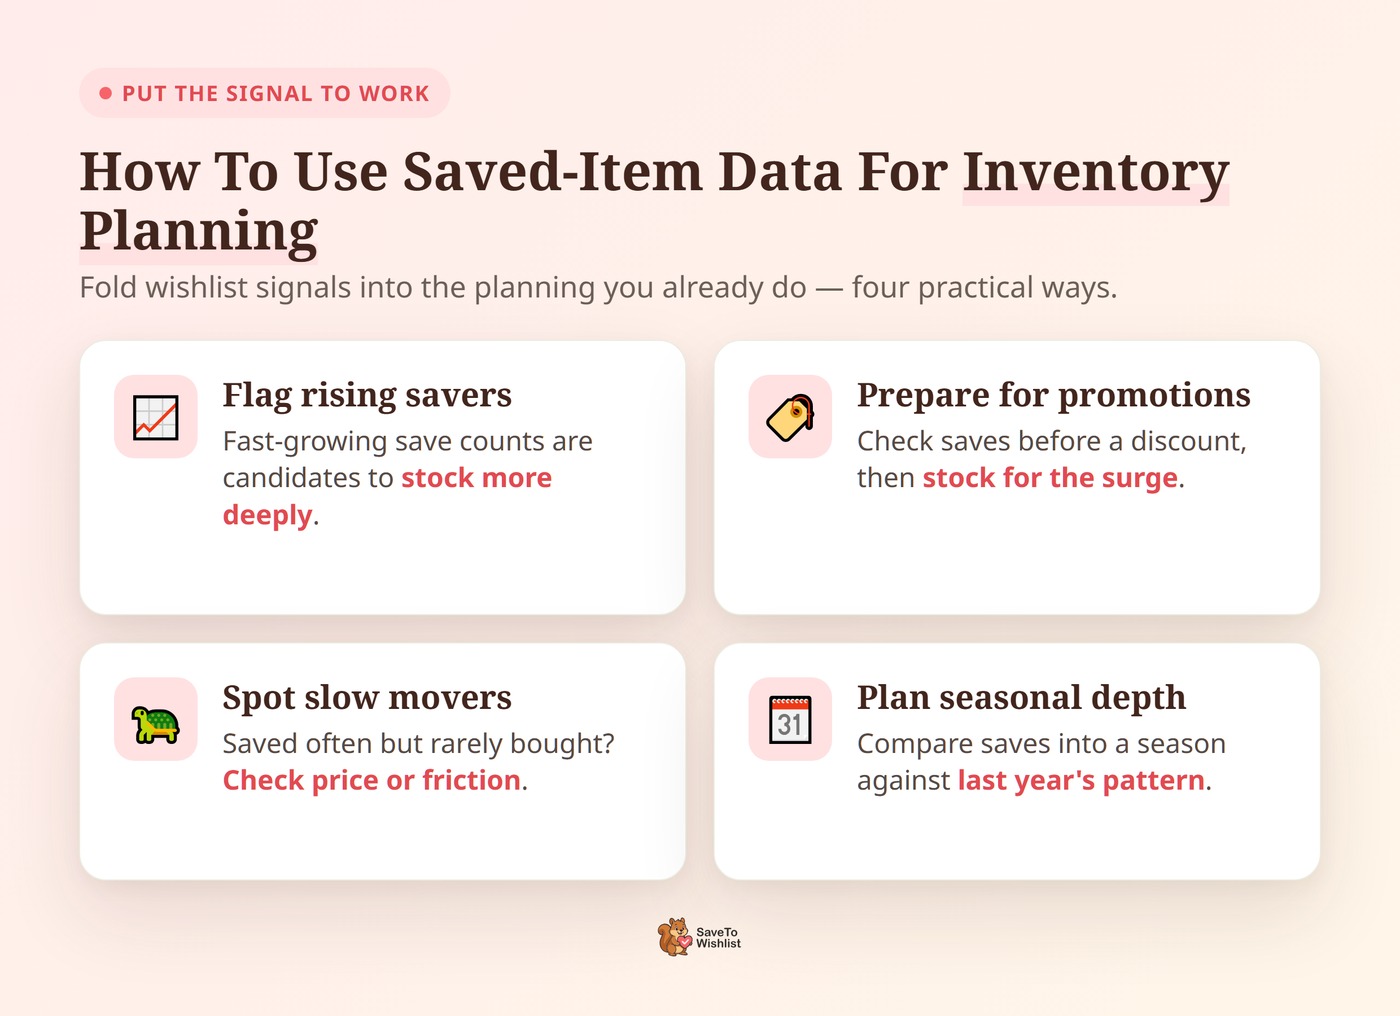
Wishlist signals are most useful when you fold them into your regular demand planning rather than trying to replace it entirely. Instead of just guessing, here’s exactly how to turn your wishlist dashboard numbers into smart inventory decisions:
- Flag rising savers: Don’t just guess what “fast-growing” means. A good rule of thumb is to look for a 20% spike in saves over a 7-day period. If a product normally gets 10 saves a week and suddenly jumps to 30, that’s a real trend. Flag it and order a deeper batch from your supplier before the actual sales wipe out your stock.
- Prepare for promotions: If a big discount is coming, check your wishlist data first so you can stock for the surge. If 500 people have an item saved, how many will actually buy it? As a rough baseline, expect a 10% to 15% conversion rate from that saved list during a strong sale. That means you’ll need at least 50 to 75 extra units ready to ship just to cover your highly engaged wishlist audience.
- Spot slow movers: Sometimes an item gets saved hundreds of times but rarely gets bought. That usually points to a price or friction problem. To figure it out, run a quick test. Send a highly targeted 10% discount just to the shoppers who saved it. If they suddenly buy, you know the original price was the roadblock keeping them away.
- Plan seasonal depth: Compare saves heading into a season against last year’s pattern. For example, if you sell winter gear, look at your September wishlist data. If your heavy coats are getting saved twice as fast as they were last September, you know you need a much bigger Black Friday inventory order than you placed last year.
Feeding this data into your broader records keeps your demand signals connected to the rest of your customer picture.
📝 Note: Our guide on how wishlist data feeds your WooCommerce CRM covers that link in detail.
Plus, always make sure your product availability is accurate everywhere, including your Google Shopping product feed. That way, the demand you forecast actually converts into real sales when shoppers go looking.
Keep Your Forecasts Honest
Wishlist data is an incredibly powerful tool. However, let’s be real: it isn’t a guarantee. Not every single person who saves an item will actually buy it. Plus, shopping behavior changes a lot depending on what you’re selling and how much it costs.
So, use your wishlist data to reduce your blind spots, not to completely replace your common sense.
Always combine what your customers are saving with your past sales history, seasonal trends, and your own gut feeling. Treat your forecast as a rough estimate that you’ll constantly tweak as real orders start rolling in.
Remember, your goal isn’t to be 100% perfect; it’s just to make a much smarter guess than past sales alone can give you.
Your Ecommerce Demand Forecasting Checklist
- Blend sales history with forward signals, not history alone.
- Watch wishlist save trends for products gaining momentum.
- Stock more deeply for items with rising saves before a promotion.
- Investigate heavily-saved but rarely-bought products.
- Treat wishlist data as a leading indicator, refined by real orders.
Forecast With What Customers Are Telling You
Ecommerce demand forecasting for ecommerce gets sharper the moment you stop relying only on the past. Wishlist data gives you a forward look at what shoppers intend to buy. As a result, you can use these signals to predict demand and prepare for it instead of scrambling after it. Pair that signal with your sales history and good judgment, and you’ll stock smarter.
Here’s the short version:
- Understand ecommerce demand forecasting and its costs when it’s wrong.
- See why past sales aren’t enough on their own.
- Use wishlist data as a leading indicator.
- Fold it into your inventory planning.
Want an early read on demand? Watch what your shoppers are saving. Get SaveTo Wishlist Pro and discover how it can benefit your store!
Frequently Asked Questions
What is demand forecasting in ecommerce?
Ecommerce demand forecasting is predicting how much of a product customers will buy over a future period. The aim is to stock enough to meet demand without over-investing in inventory. It blends sales history, trends, seasonality, and signals about future intent.
Why isn’t sales history enough for forecasting?
Sales history only shows what already happened, so it misses demand that’s currently building. Think interest in a new product or an item gaining momentum. Leading signals such as wishlist saves help you anticipate demand rather than react to it.
How does wishlist data help with ecommerce demand forecasting?
A wishlist save happens before purchase, making it a forward-looking signal. Aggregated saved-item data shows which products are gaining interest. That gives you an early read on demand that sales reports only confirm later.
Can wishlist data replace traditional forecasting?
No. It’s a valuable leading indicator, not a replacement. Combine wishlist signals with sales history, seasonality, and judgment. Refine your forecast as real orders arrive, and treat each save as one input among several.
How do I act on wishlist demand signals?
Watch for products with rising save counts and stock those more deeply, especially before a planned promotion. Investigate items saved often but rarely bought. Compare seasonal save patterns year over year to plan inventory depth.